Dividend Data
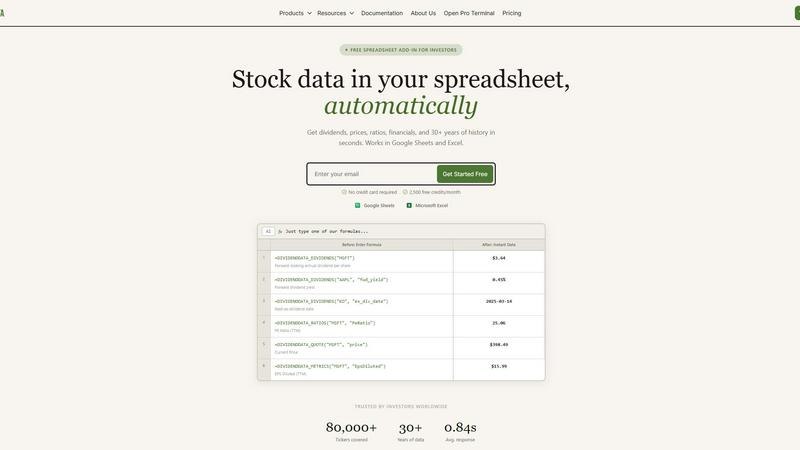
Get instant stock data like dividends and prices automatically in your Google Sheets or Excel.
About Dividend Data
Dividend Data is the revolutionary toolkit that transforms your everyday spreadsheet into a professional-grade investment research terminal. Built by a dividend investor for dividend investors, it eliminates the tedious, error-prone process of manually copying and pasting stock data. With over 30 years of historical market data for more than 80,000 tickers, it brings institutional-quality financial intelligence directly into the tools you already use: Google Sheets and Microsoft Excel. The magic happens through simple, custom formulas. Just type =DIVIDENDDATA_DIVIDENDS("MSFT") and watch the forward annual dividend appear instantly. No API keys, no complex coding, and no more jumping between browser tabs. It’s designed for fundamental and dividend investors who demand deep data—dividends, yields, payout ratios, growth rates, full financial statements, key ratios, and price history—without the institutional price tag. Start with a powerful free tier offering 2,500 monthly credits that never expire, and experience the future of streamlined, data-driven investing today.
Features of Dividend Data
Instant Spreadsheet Integration
Access over 100 critical metrics directly in your cells with 16 simple custom formulas. Whether you need the next ex-dividend date for Coca-Cola or the current P/E ratio for Microsoft, just type a function like =DIVIDENDDATA_QUOTE("MSFT", "price") and get live, updating data in under a second. It works seamlessly in both Google Sheets and Excel, turning your spreadsheet into a dynamic, connected research platform without any coding required.
Comprehensive Dividend & Fundamental Data
Go beyond simple quotes with 30+ years of deep historical data tailored for serious analysis. Get forward dividends, yields, payout ratios, and dividend growth rates. Dive into complete financial statements, earnings reports, and essential valuation and profitability ratios. This feature provides the complete picture for evaluating a company's financial health and income potential over the long term.
Generous Free Tier with Perpetual Access
Jumpstart your analysis immediately with no credit card required. The free plan offers 2,500 credits every month, and crucially, it never expires. This allows you to thoroughly test the platform, build complex models, and perform significant research without any time pressure or trial period limitations, making professional data truly accessible.
Multi-Platform Terminal & AI Tools
Beyond spreadsheets, access the flagship Dividend Data Terminal web-app. It features advanced data visualizations, automated portfolio tracking, and an AI-powered research assistant. This ecosystem approach means you can conduct deep, exploratory research in the Terminal and seamlessly implement the findings in your live spreadsheet models, all within one connected platform.
Use Cases of Dividend Data
Building a Dividend Growth Model
Easily screen and model dividend aristocrats and kings. Use functions to pull decades of dividend history and growth rates directly into your spreadsheet to calculate Chowder Numbers, analyze payout safety through ratios, and forecast future income. Automate your entire screening process to identify the most reliable long-term income stocks without manual data entry.
Creating a Live Portfolio Dashboard
Construct a master portfolio tracker that updates in real-time. Link cells to pull current prices, dividend yields, and annual income for each holding. Aggregate totals to see your portfolio's overall yield, projected income, and daily value change automatically, giving you a constantly up-to-date snapshot of your investments.
Conducting Comparative Company Analysis
Quickly pull key financial ratios and metrics for multiple companies side-by-side. Compare P/E ratios, debt-to-equity, profit margins, and revenue growth across an entire sector directly in a single sheet. This allows for fast, data-driven investment thesis development and peer group benchmarking.
Automating Financial Statement Analysis
Streamline deep dives into company fundamentals. Use formulas to import entire income statements, balance sheets, and cash flow statements over multiple years. Calculate custom ratios, track trends in revenue and EPS, and assess financial health automatically, saving hours of manual data collection and formatting.
Frequently Asked Questions
How does the free tier work?
The free tier provides 2,500 credits every month, which renew automatically. There is no expiration date or trial period; you can use the free plan indefinitely. Credits are used each time a spreadsheet function recalculates and fetches fresh data from our servers, allowing for substantial usage for personal analysis and modeling.
What data can I access with the spreadsheet functions?
You can access over 100 metrics spanning dividends, quotes, financial ratios, and fundamental data. This includes forward and historical dividends, yield, ex-dividend dates, current price, volume, P/E ratio, EPS, revenue, EBITDA, and much more. Full documentation lists all available functions and their parameters.
Do I need to install software?
For Google Sheets, you install an Add-on from the Google Workspace Marketplace. For Microsoft Excel, you install an Add-in from Microsoft AppSource. Both processes are quick and guided. Once installed, the custom functions are available in your spreadsheet just like native formulas, with no separate software to run.
Is my data and portfolio information secure?
Yes. Dividend Data uses secure, encrypted connections for all data transmission. Your portfolio data and API usage are kept private. The company does not sell your personal data or investment information. You can review the full details in the Privacy Policy available on the website.
Explore more in this category:
Top Alternatives to Dividend Data
Decker
Decker is the all-in-one operating system and monetization platform that helps consultants build, learn, belong, and earn from their deliverables.

Liners Africa
Discover, compare, and review over 1,500 African software products with insights from human researchers and AI for smarter choices.

Fake Mayo
Fake Mayo delivers real startup stories with exact traction tactics, no fluff, just proven moves.

WhoFixedIt
WhoFixedIt is your ultimate logbook to track repairs and trusted service providers for your home or business, making maintenance a breeze.

VolRadar
VolRadar scans 500 stocks overnight to give you the best premium selling setups before the bell, so your morning research takes 30 seconds.
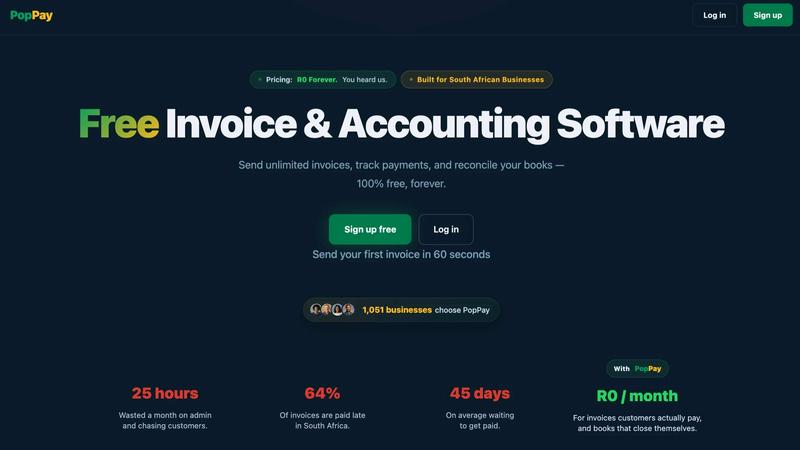
PopPay
PopPay brings free, end-to-end AI business management to your fingertips with launch-day energy and total control.
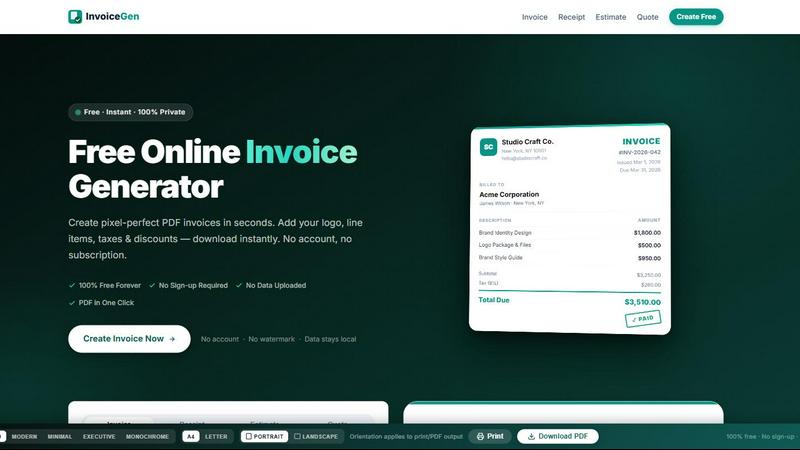
Online Invoice Generator
Create stunning PDF invoices instantly with zero sign-up, no data uploads, and 100% free forever.
StockFit API
Unlock powerful financial modeling with StockFit API, delivering standardized data and sector-aware metrics for accurate valuation and backtesting.