Changeflow vs Dividend Data
Changeflow
Changeflow uses AI to monitor web pages for critical updates, delivering tailored summaries straight to your inbox.
Last updated: March 4, 2026
Visual Comparison
Changeflow
Dividend Data
Overview
About Changeflow
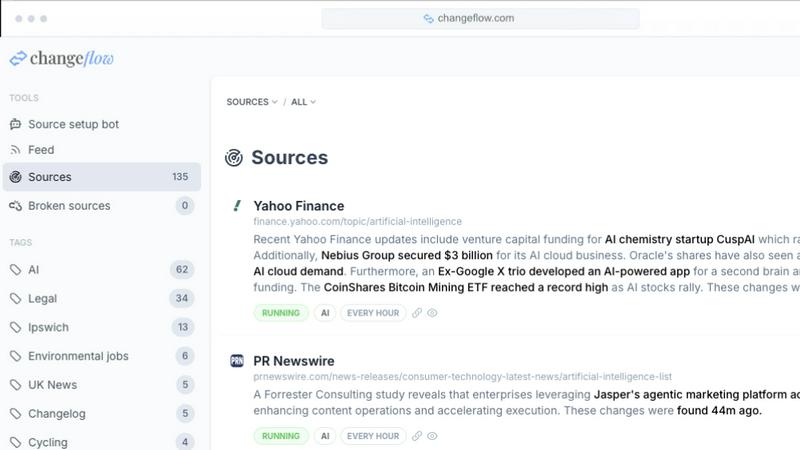
Changeflow is an innovative web monitoring tool designed to keep you informed of essential changes happening across the internet. Unlike traditional monitoring services that merely notify you when "something has changed," Changeflow uses advanced AI to analyze web pages and provide detailed summaries of what matters most to you. This makes it an invaluable resource for various professionals, including business teams, legal librarians, and compliance officers. With Changeflow, you can effortlessly track competitor pricing, monitor regulatory changes, and stay updated on industry news without the hassle of manual checks. The setup is a breeze: simply describe what you want to track in plain English, and Changeflow handles the complexities of web pages, even those behind login walls or laden with JavaScript. With over 1 billion pages checked and a remarkable 99.9% success rate, Changeflow is trusted by Fortune 500 companies and Am Law 200 firms alike, ensuring that you never miss a critical update again.
About Dividend Data
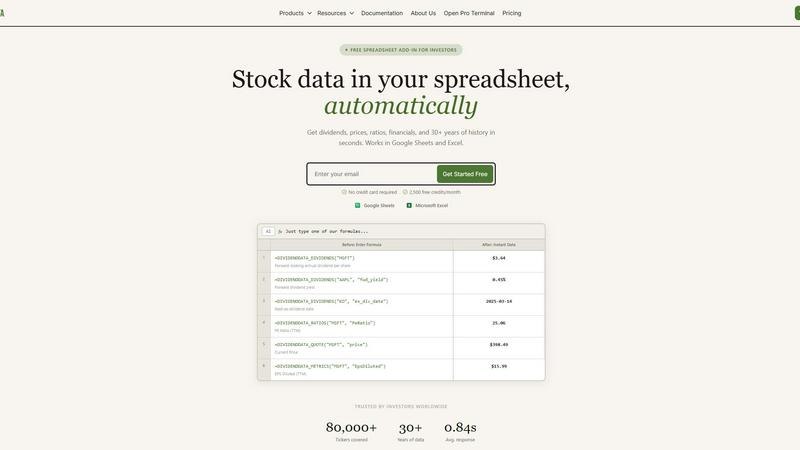
Dividend Data brings 30+ years of stock market data for 80,000+ tickers directly into your Google Sheets and Microsoft Excel spreadsheets — no API keys, no coding, no copying and pasting.
Built for dividend & fundamental investors, it gives you instant access to dividends, yields, payout ratios, growth rates, financial statements, earnings, ratios, price history, and 100+ metrics through simple custom formulas.
Just type a formula. The data appears live.
What makes it different:
• Free tier with 2,500 monthly credits — no trial expiration
• 16 custom functions covering everything dividend investors need
• 30+ years of historical data
• Works in both Google Sheets and Microsoft Excel
• Built by a dividend investor, for dividend investors
Used by fundamental investors who want institutional-grade data without the institutional price tag.