Dividend Data vs MonsterOps
Dividend Data
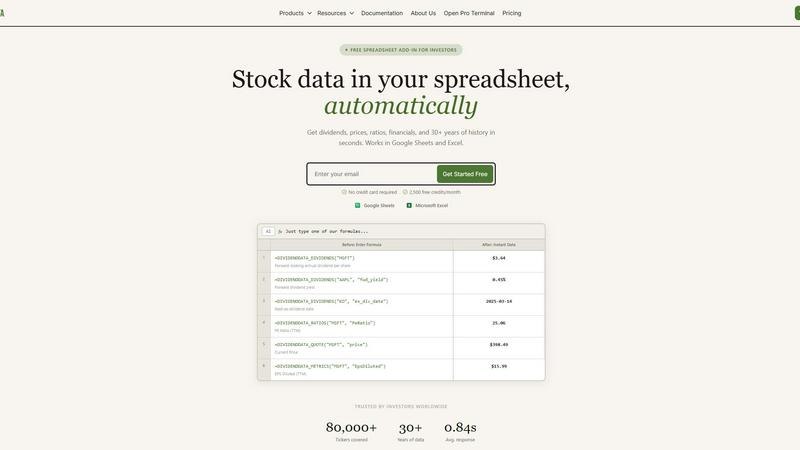
Get instant stock data like dividends and prices automatically in your Google Sheets or Excel.
Last updated: March 11, 2026
MonsterOps
Money Visualiser turns any amount into interactive 3D bill stacks using real banknote sizes.
Last updated: February 28, 2026
Visual Comparison
Dividend Data
MonsterOps
Feature Comparison
Dividend Data
Instant Spreadsheet Integration
Access over 100 critical metrics directly in your cells with 16 simple custom formulas. Whether you need the next ex-dividend date for Coca-Cola or the current P/E ratio for Microsoft, just type a function like =DIVIDENDDATA_QUOTE("MSFT", "price") and get live, updating data in under a second. It works seamlessly in both Google Sheets and Excel, turning your spreadsheet into a dynamic, connected research platform without any coding required.
Comprehensive Dividend & Fundamental Data
Go beyond simple quotes with 30+ years of deep historical data tailored for serious analysis. Get forward dividends, yields, payout ratios, and dividend growth rates. Dive into complete financial statements, earnings reports, and essential valuation and profitability ratios. This feature provides the complete picture for evaluating a company's financial health and income potential over the long term.
Generous Free Tier with Perpetual Access
Jumpstart your analysis immediately with no credit card required. The free plan offers 2,500 credits every month, and crucially, it never expires. This allows you to thoroughly test the platform, build complex models, and perform significant research without any time pressure or trial period limitations, making professional data truly accessible.
Multi-Platform Terminal & AI Tools
Beyond spreadsheets, access the flagship Dividend Data Terminal web-app. It features advanced data visualizations, automated portfolio tracking, and an AI-powered research assistant. This ecosystem approach means you can conduct deep, exploratory research in the Terminal and seamlessly implement the findings in your live spreadsheet models, all within one connected platform.
MonsterOps
The Unified Strategy Workspace
Ditch the dozen tabs and fragmented tools. MonsterOps provides one central, digital hub for your entire operating system. Consolidate your Vision/Traction Organizer (V/TO), Rocks (quarterly priorities), Issues List, Scorecard, and To-Dos into a single, interconnected platform. This eliminates confusion, ensures everyone has one source of truth, and creates a living blueprint for your business that your entire team can access and contribute to.
Leadership Meeting Facilitator
Run your Level 10 meetings or leadership syncs with unprecedented efficiency. MonsterOps comes with built-in, customizable meeting agendas that follow proven frameworks to keep discussions focused and productive. Integrated timekeeping tools ensure every agenda item gets its due without running over, while automatic logging of issues, decisions, and to-dos means nothing falls through the cracks and accountability is crystal clear.
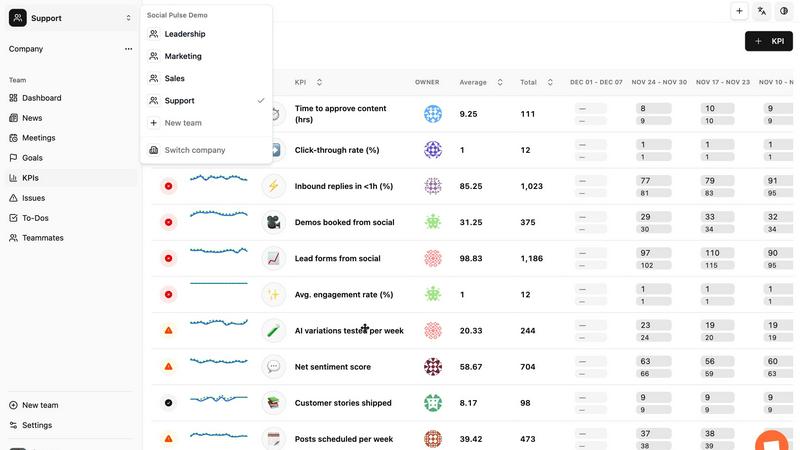
Real-Time KPI & Scorecard Dashboard
Move from guessing to knowing with a live dashboard that tracks your business's vital signs. Define and monitor your key performance indicators (KPIs) in real-time, giving you and your leadership team instant visibility into what's working and what's not. This continuous pulse check keeps teams aligned, drives data-driven decisions, and ensures you're always moving toward your most critical goals.
Flexible Business OS Framework
MonsterOps is built to adapt to your business, not the other way around. While it's perfectly tailored for companies implementing EOS, its core structure is flexible enough to support any business operating system or methodology. Customize your terminology, workflows, and meeting rhythms to match your company's unique culture and processes, making adoption seamless and effective.
Use Cases
Dividend Data
Building a Dividend Growth Model
Easily screen and model dividend aristocrats and kings. Use functions to pull decades of dividend history and growth rates directly into your spreadsheet to calculate Chowder Numbers, analyze payout safety through ratios, and forecast future income. Automate your entire screening process to identify the most reliable long-term income stocks without manual data entry.
Creating a Live Portfolio Dashboard
Construct a master portfolio tracker that updates in real-time. Link cells to pull current prices, dividend yields, and annual income for each holding. Aggregate totals to see your portfolio's overall yield, projected income, and daily value change automatically, giving you a constantly up-to-date snapshot of your investments.
Conducting Comparative Company Analysis
Quickly pull key financial ratios and metrics for multiple companies side-by-side. Compare P/E ratios, debt-to-equity, profit margins, and revenue growth across an entire sector directly in a single sheet. This allows for fast, data-driven investment thesis development and peer group benchmarking.
Automating Financial Statement Analysis
Streamline deep dives into company fundamentals. Use formulas to import entire income statements, balance sheets, and cash flow statements over multiple years. Calculate custom ratios, track trends in revenue and EPS, and assess financial health automatically, saving hours of manual data collection and formatting.
MonsterOps
Implementing EOS Without a Consultant
For businesses attracted to the discipline of the Entrepreneurial Operating System but hesitant about the cost of a full-time implementer, MonsterOps is the perfect guide. It provides the structured tools, templates, and meeting formats of EOS in a self-serve platform, enabling leadership teams to implement the framework step-by-step, stay on track, and achieve traction with greater confidence and independence.
Aligning Remote & Hybrid Teams
When your team is not in the same room every day, alignment is your biggest challenge. MonsterOps creates a virtual headquarters for your operations. The single workspace ensures everyone, from leadership to department heads, has access to the same goals, priorities, and metrics, fostering transparency and unified execution regardless of physical location.
Scaling Beyond Founder-Led Chaos
Founders often hit a wall where their personal oversight can no longer manage growing complexity. MonsterOps systemizes that oversight. It captures the founder's strategic vision and translates it into an executable framework that the entire team can follow, enabling scalable growth, predictable operations, and freeing leadership to focus on the future instead of daily fires.
Streamlining Quarterly Planning & Execution
Turn your big annual vision into achievable quarterly wins. Use MonsterOps to set clear Quarterly Rocks (priorities), break them down into accountable tasks, and track progress in real-time against your scorecard. This closes the loop between long-term strategy and short-term execution, ensuring every 90-day cycle moves the company meaningfully forward.
Overview
About Dividend Data
Dividend Data is the revolutionary toolkit that transforms your everyday spreadsheet into a professional-grade investment research terminal. Built by a dividend investor for dividend investors, it eliminates the tedious, error-prone process of manually copying and pasting stock data. With over 30 years of historical market data for more than 80,000 tickers, it brings institutional-quality financial intelligence directly into the tools you already use: Google Sheets and Microsoft Excel. The magic happens through simple, custom formulas. Just type =DIVIDENDDATA_DIVIDENDS("MSFT") and watch the forward annual dividend appear instantly. No API keys, no complex coding, and no more jumping between browser tabs. It’s designed for fundamental and dividend investors who demand deep data—dividends, yields, payout ratios, growth rates, full financial statements, key ratios, and price history—without the institutional price tag. Start with a powerful free tier offering 2,500 monthly credits that never expire, and experience the future of streamlined, data-driven investing today.
About MonsterOps
Tired of the chaos? Welcome to MonsterOps, the all-in-one Business Operating System (BOS) engineered to bring order, alignment, and predictable growth to your small or mid-sized business. It's the command center you've been missing, designed specifically for founders and leadership teams who are done with firefighting and ready to build a scalable, strategic machine. MonsterOps replaces the frustrating mess of scattered spreadsheets, disconnected documents, and siloed task apps with a single, unified workspace. Here, your company's vision, goals, critical challenges, and daily to-dos finally live in harmony. Whether you're self-implementing a popular framework like EOS (Entrepreneurial Operating System) or building your own unique operating rhythm, MonsterOps provides the flexible yet powerful structure to make it stick. Get instant visibility into your business health with real-time KPI tracking, run hyper-efficient leadership meetings with built-in tools, and ensure every team member is rowing in the same direction. Stop juggling and start executing. MonsterOps is your launchpad from operational chaos to strategic clarity.
Frequently Asked Questions
Dividend Data FAQ
How does the free tier work?
The free tier provides 2,500 credits every month, which renew automatically. There is no expiration date or trial period; you can use the free plan indefinitely. Credits are used each time a spreadsheet function recalculates and fetches fresh data from our servers, allowing for substantial usage for personal analysis and modeling.
What data can I access with the spreadsheet functions?
You can access over 100 metrics spanning dividends, quotes, financial ratios, and fundamental data. This includes forward and historical dividends, yield, ex-dividend dates, current price, volume, P/E ratio, EPS, revenue, EBITDA, and much more. Full documentation lists all available functions and their parameters.
Do I need to install software?
For Google Sheets, you install an Add-on from the Google Workspace Marketplace. For Microsoft Excel, you install an Add-in from Microsoft AppSource. Both processes are quick and guided. Once installed, the custom functions are available in your spreadsheet just like native formulas, with no separate software to run.
Is my data and portfolio information secure?
Yes. Dividend Data uses secure, encrypted connections for all data transmission. Your portfolio data and API usage are kept private. The company does not sell your personal data or investment information. You can review the full details in the Privacy Policy available on the website.
MonsterOps FAQ
What is a Business Operating System (BOS)?
A Business Operating System is a set of tools, processes, and rhythms that align your entire company around a shared vision and strategy. It's the "how" you run your business—how you set goals, track progress, solve problems, and run meetings. MonsterOps is the digital platform that houses and powers your chosen BOS, making it consistent, accessible, and effective for everyone.
Is MonsterOps only for companies using EOS?
Not at all! While MonsterOps is an exceptional tool for implementing EOS and comes with EOS-specific terminology and structures built-in, it is fundamentally a flexible platform. You can customize the language, meeting agendas, and core components to support any operating framework or methodology your leadership team prefers to use.
How does MonsterOps improve leadership meetings?
It provides structure and automation. Built-in agendas keep meetings on a proven, productive path. Timer functions prevent tangents. Most importantly, it seamlessly integrates meeting outputs: issues are logged directly to the Issues List, decisions are recorded, and To-Dos are assigned with deadlines right within the platform, eliminating post-meeting admin work and ensuring follow-through.
Can we track financial and operational metrics?
Absolutely. The real-time KPI Scorecard is a core feature. You can define the critical numbers for your business—whether they are financial (revenue, profit), operational (customer satisfaction, project completion), or team-based—and input data to track them weekly. The dashboard gives everyone instant visibility into performance against targets.
Alternatives
Dividend Data Alternatives
Dividend Data is an automatic stock data platform that brings institutional-grade financial data directly into your spreadsheets. It falls into the category of financial data tools designed for self-directed investors, specifically those focused on dividends and fundamental analysis. It turns Google Sheets and Excel into powerful, live research terminals with simple formulas. Users often explore alternatives for a few key reasons. They might need a different pricing model, require specific data points or integrations not offered, or need a solution that works on a different platform entirely. Some may seek more advanced analytical tools or a different user experience beyond the spreadsheet environment. When evaluating any tool in this space, focus on your core needs. Consider the depth and history of the data, the reliability and update frequency, the total cost, and how seamlessly it fits into your existing workflow. The best choice is the one that gives you accurate, actionable data with the least amount of friction, letting you focus on analysis instead of data collection.
MonsterOps Alternatives
MonsterOps is a dynamic Business Operating System (BOS) designed to help small and mid-sized companies unify their strategy, goals, and daily execution in one cohesive workspace. It falls squarely into the productivity and management category, acting as the central nervous system for a growing business. Users often explore alternatives for various reasons, such as budget constraints, the need for more specialized features, or a preference for a different platform ecosystem. Every team has unique workflows, and finding a tool that aligns perfectly with your company's size, culture, and operational rhythm is crucial. When evaluating other options, focus on core needs: does it centralize your goals and KPIs? Can it streamline leadership meetings and accountability? The right alternative should bring clarity, reduce app-switching chaos, and genuinely help your team move from reactive firefighting to predictable, strategic growth.