Dividend Data vs Tradepal
Dividend Data
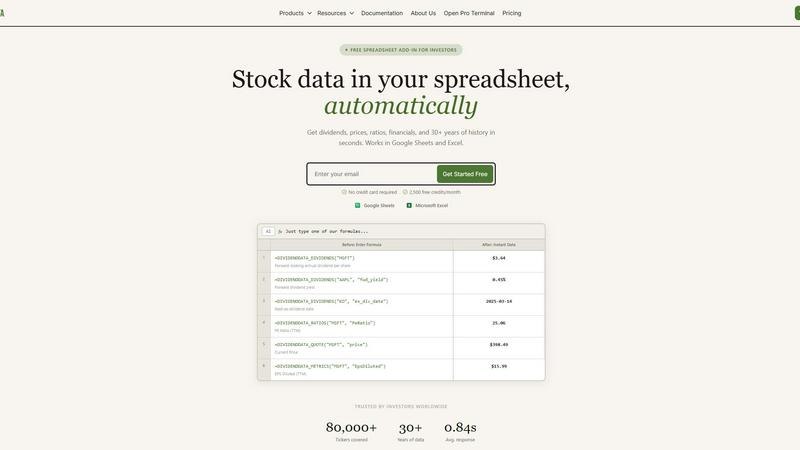
Get instant stock data like dividends and prices automatically in your Google Sheets or Excel.
Last updated: March 11, 2026
Tradepal
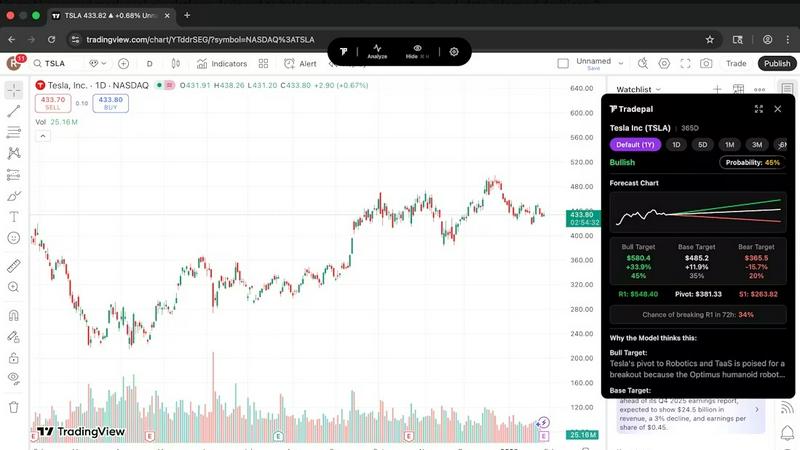
Tradepal is your AI trading co-pilot, delivering real-time insights and forecasts to enhance your trading decisions.
Last updated: February 28, 2026
Visual Comparison
Dividend Data
Tradepal
Feature Comparison
Dividend Data
Instant Spreadsheet Integration
Access over 100 critical metrics directly in your cells with 16 simple custom formulas. Whether you need the next ex-dividend date for Coca-Cola or the current P/E ratio for Microsoft, just type a function like =DIVIDENDDATA_QUOTE("MSFT", "price") and get live, updating data in under a second. It works seamlessly in both Google Sheets and Excel, turning your spreadsheet into a dynamic, connected research platform without any coding required.
Comprehensive Dividend & Fundamental Data
Go beyond simple quotes with 30+ years of deep historical data tailored for serious analysis. Get forward dividends, yields, payout ratios, and dividend growth rates. Dive into complete financial statements, earnings reports, and essential valuation and profitability ratios. This feature provides the complete picture for evaluating a company's financial health and income potential over the long term.
Generous Free Tier with Perpetual Access
Jumpstart your analysis immediately with no credit card required. The free plan offers 2,500 credits every month, and crucially, it never expires. This allows you to thoroughly test the platform, build complex models, and perform significant research without any time pressure or trial period limitations, making professional data truly accessible.
Multi-Platform Terminal & AI Tools
Beyond spreadsheets, access the flagship Dividend Data Terminal web-app. It features advanced data visualizations, automated portfolio tracking, and an AI-powered research assistant. This ecosystem approach means you can conduct deep, exploratory research in the Terminal and seamlessly implement the findings in your live spreadsheet models, all within one connected platform.
Tradepal
AI Forecasts
Tradepal provides intraday forecasts for price ranges, reversals, and volatility. These forecasts are generated from a blended AI ensemble that updates in real time, allowing traders to assess risks before they manifest in price movements. This feature helps traders stay ahead of market changes and make proactive decisions.
Price Cone Projections
With Tradepal's intuitive layout, users can visualize forward price cones directly on their charts. This feature is customizable according to individual trading styles, enabling traders to save their preferred views for future sessions. It enhances the user experience by providing clear and actionable insights.
News and Sentiment Analysis
Stay informed with Tradepal's comprehensive news and sentiment analysis feature. Traders can track the market mood across professional trading sources and financial news in one consolidated stream. This allows users to recognize when crowd conviction is building, potentially signaling impending market movements.
Universal Chart Support
Tradepal’s AI technology ensures that users can analyze any chart from any platform instantly. By simply displaying a stock chart or uploading a screenshot, Tradepal delivers forecasts, sentiment, and price targets in seconds. This universal support empowers traders to leverage AI insights regardless of their chosen trading platform.
Use Cases
Dividend Data
Building a Dividend Growth Model
Easily screen and model dividend aristocrats and kings. Use functions to pull decades of dividend history and growth rates directly into your spreadsheet to calculate Chowder Numbers, analyze payout safety through ratios, and forecast future income. Automate your entire screening process to identify the most reliable long-term income stocks without manual data entry.
Creating a Live Portfolio Dashboard
Construct a master portfolio tracker that updates in real-time. Link cells to pull current prices, dividend yields, and annual income for each holding. Aggregate totals to see your portfolio's overall yield, projected income, and daily value change automatically, giving you a constantly up-to-date snapshot of your investments.
Conducting Comparative Company Analysis
Quickly pull key financial ratios and metrics for multiple companies side-by-side. Compare P/E ratios, debt-to-equity, profit margins, and revenue growth across an entire sector directly in a single sheet. This allows for fast, data-driven investment thesis development and peer group benchmarking.
Automating Financial Statement Analysis
Streamline deep dives into company fundamentals. Use formulas to import entire income statements, balance sheets, and cash flow statements over multiple years. Calculate custom ratios, track trends in revenue and EPS, and assess financial health automatically, saving hours of manual data collection and formatting.
Tradepal
Validating Trading Ideas
Traders can use Tradepal to validate their trading strategies and ideas by analyzing stock charts quickly. The AI-generated insights help confirm or challenge their initial thoughts, fostering more informed decision-making and reducing reliance on gut feelings.
Monitoring Market Sentiment
Active traders can leverage the news and sentiment analysis feature to keep a pulse on market mood. By tracking sentiment trends, they can position themselves strategically and take advantage of emerging opportunities before the broader market reacts.
Executing Quick Analysis
During busy trading sessions, traders can use Tradepal to conduct quick analyses of multiple stocks. By simply clicking "Analyze," they can receive immediate insights that help them make fast, informed trades without being bogged down by extensive research.
Creating Custom Watchlists
Traders can create personalized watchlists with smart alerts for unusual activity and risk stress events. This feature allows users to stay prepared and focused on the stocks that matter most to them without needing to monitor the market continuously.
Overview
About Dividend Data
Dividend Data is the revolutionary toolkit that transforms your everyday spreadsheet into a professional-grade investment research terminal. Built by a dividend investor for dividend investors, it eliminates the tedious, error-prone process of manually copying and pasting stock data. With over 30 years of historical market data for more than 80,000 tickers, it brings institutional-quality financial intelligence directly into the tools you already use: Google Sheets and Microsoft Excel. The magic happens through simple, custom formulas. Just type =DIVIDENDDATA_DIVIDENDS("MSFT") and watch the forward annual dividend appear instantly. No API keys, no complex coding, and no more jumping between browser tabs. It’s designed for fundamental and dividend investors who demand deep data—dividends, yields, payout ratios, growth rates, full financial statements, key ratios, and price history—without the institutional price tag. Start with a powerful free tier offering 2,500 monthly credits that never expire, and experience the future of streamlined, data-driven investing today.
About Tradepal
Tradepal is an innovative AI-powered trading assistant designed specifically for active traders and investors seeking fast, objective chart analysis without the hassle of manual guesswork. This powerful tool allows users to analyze any U.S.-listed stock chart effortlessly by simply clicking "Analyze" while the chart is displayed or by uploading a screenshot through the web app. Tradepal harnesses advanced AI technology to detect essential technical patterns, identify support and resistance levels, assess trend strength, and evaluate momentum. It then generates clear scenarios for bullish, bearish, and base outcomes, complete with confidence scores and price targets. Unlike conventional trading platforms, Tradepal does not execute trades; instead, it serves as a reliable second opinion, helping traders validate their ideas, minimize emotional biases, and make more informed decisions. Designed to integrate seamlessly into existing workflows, Tradepal works across popular charting platforms, ensuring a lightweight, fast, and trader-focused experience. It is the ideal solution for those who want AI assistance without disrupting their trading habits.
Frequently Asked Questions
Dividend Data FAQ
How does the free tier work?
The free tier provides 2,500 credits every month, which renew automatically. There is no expiration date or trial period; you can use the free plan indefinitely. Credits are used each time a spreadsheet function recalculates and fetches fresh data from our servers, allowing for substantial usage for personal analysis and modeling.
What data can I access with the spreadsheet functions?
You can access over 100 metrics spanning dividends, quotes, financial ratios, and fundamental data. This includes forward and historical dividends, yield, ex-dividend dates, current price, volume, P/E ratio, EPS, revenue, EBITDA, and much more. Full documentation lists all available functions and their parameters.
Do I need to install software?
For Google Sheets, you install an Add-on from the Google Workspace Marketplace. For Microsoft Excel, you install an Add-in from Microsoft AppSource. Both processes are quick and guided. Once installed, the custom functions are available in your spreadsheet just like native formulas, with no separate software to run.
Is my data and portfolio information secure?
Yes. Dividend Data uses secure, encrypted connections for all data transmission. Your portfolio data and API usage are kept private. The company does not sell your personal data or investment information. You can review the full details in the Privacy Policy available on the website.
Tradepal FAQ
How do I use Tradepal?
After signing up, you can download Tradepal for macOS or Windows, which remains accessible while you trade. When viewing a U.S.-listed stock chart on any platform, simply click "Analyze," and Tradepal instantly generates insights based on the chart.
Is Tradepal financial advice?
Tradepal provides analysis and insights based on AI and charting data but is not a substitute for personalized financial advice. Users should consider their own financial situations and consult with a financial advisor when making investment decisions.
What charts are compatible with Tradepal?
Tradepal is compatible with any U.S.-listed stock charts from various platforms. Users can analyze charts displayed on their preferred trading software or upload screenshots for analysis through the web app.
Does Tradepal work on all timeframes?
Yes, Tradepal is designed to work on various timeframes, enabling traders to analyze charts from intraday to longer-term perspectives. This versatility makes it a valuable tool for different trading styles and strategies.
Alternatives
Dividend Data Alternatives
Dividend Data is an automatic stock data platform that brings institutional-grade financial data directly into your spreadsheets. It falls into the category of financial data tools designed for self-directed investors, specifically those focused on dividends and fundamental analysis. It turns Google Sheets and Excel into powerful, live research terminals with simple formulas. Users often explore alternatives for a few key reasons. They might need a different pricing model, require specific data points or integrations not offered, or need a solution that works on a different platform entirely. Some may seek more advanced analytical tools or a different user experience beyond the spreadsheet environment. When evaluating any tool in this space, focus on your core needs. Consider the depth and history of the data, the reliability and update frequency, the total cost, and how seamlessly it fits into your existing workflow. The best choice is the one that gives you accurate, actionable data with the least amount of friction, letting you focus on analysis instead of data collection.
Tradepal Alternatives
Tradepal is an innovative AI-powered trading assistant designed for active traders and investors seeking efficient and objective chart analysis. With its ability to analyze U.S.-listed stock charts quickly, Tradepal eliminates guesswork by detecting key technical patterns, support and resistance levels, and generating actionable insights. This unique approach positions Tradepal within the Business & Finance category, catering to those who want to enhance their trading decisions. Users often seek alternatives to Tradepal for a variety of reasons, including pricing, specific feature sets, or compatibility with different trading platforms. When exploring alternatives, it's essential to consider factors such as the ease of integration into existing workflows, the quality of the analysis provided, and the overall user experience. Choosing the right trading assistant can significantly impact your trading strategy, so take the time to assess how well the alternative meets your individual needs.