Dividend Data vs echoloc
Dividend Data
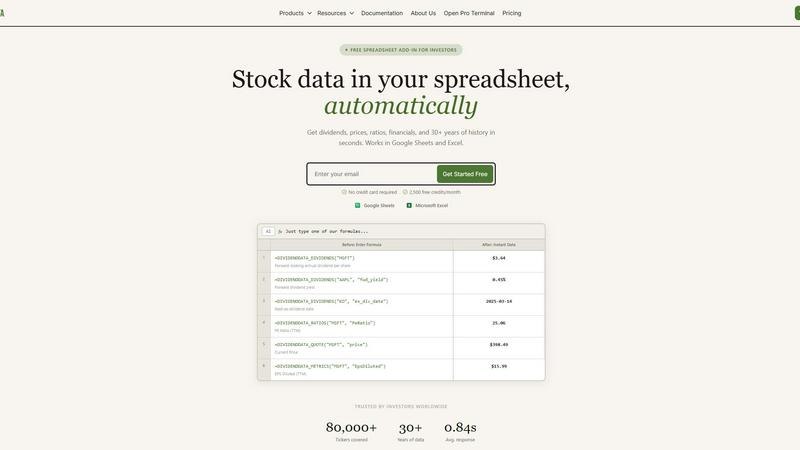
Get instant stock data like dividends and prices automatically in your Google Sheets or Excel.
Last updated: March 11, 2026
echoloc
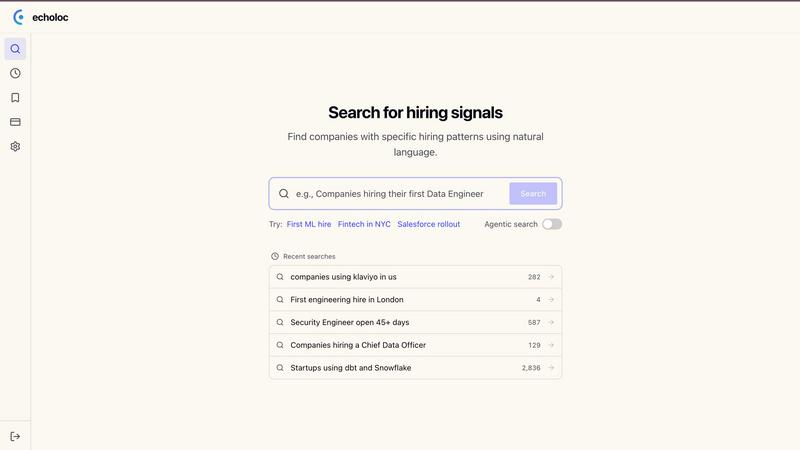
Discover buyer intent through real-time job postings before they signal a need.
Last updated: February 27, 2026
Visual Comparison
Dividend Data
echoloc
Feature Comparison
Dividend Data
Instant Spreadsheet Integration
Access over 100 critical metrics directly in your cells with 16 simple custom formulas. Whether you need the next ex-dividend date for Coca-Cola or the current P/E ratio for Microsoft, just type a function like =DIVIDENDDATA_QUOTE("MSFT", "price") and get live, updating data in under a second. It works seamlessly in both Google Sheets and Excel, turning your spreadsheet into a dynamic, connected research platform without any coding required.
Comprehensive Dividend & Fundamental Data
Go beyond simple quotes with 30+ years of deep historical data tailored for serious analysis. Get forward dividends, yields, payout ratios, and dividend growth rates. Dive into complete financial statements, earnings reports, and essential valuation and profitability ratios. This feature provides the complete picture for evaluating a company's financial health and income potential over the long term.
Generous Free Tier with Perpetual Access
Jumpstart your analysis immediately with no credit card required. The free plan offers 2,500 credits every month, and crucially, it never expires. This allows you to thoroughly test the platform, build complex models, and perform significant research without any time pressure or trial period limitations, making professional data truly accessible.
Multi-Platform Terminal & AI Tools
Beyond spreadsheets, access the flagship Dividend Data Terminal web-app. It features advanced data visualizations, automated portfolio tracking, and an AI-powered research assistant. This ecosystem approach means you can conduct deep, exploratory research in the Terminal and seamlessly implement the findings in your live spreadsheet models, all within one connected platform.
echoloc
Real-Time Job Posting Analysis
Echoloc continuously analyzes millions of job postings to extract valuable buying signals. This feature ensures that sales teams have access to the most current data, allowing them to act quickly when opportunities arise.
Evidence-Based Insights
Each result generated by Echoloc comes with proof from the job descriptions, eliminating guesswork. Sales reps can reference specific snippets from job postings, providing them with concrete evidence to support their outreach efforts.
Customizable Search Queries
Users can easily describe the signals they are looking for in plain English, allowing for a straightforward search experience. Whether it's "companies hiring their first VP" or "startups expanding in London," this feature tailors the search to the user's needs.
Comprehensive Tracking of Companies
Echoloc tracks over 30 million companies, providing users with insights into who is actively hiring and what roles are being filled. This extensive database allows for targeted outreach, ensuring that sales teams are connecting with the right prospects at the right time.
Use Cases
Dividend Data
Building a Dividend Growth Model
Easily screen and model dividend aristocrats and kings. Use functions to pull decades of dividend history and growth rates directly into your spreadsheet to calculate Chowder Numbers, analyze payout safety through ratios, and forecast future income. Automate your entire screening process to identify the most reliable long-term income stocks without manual data entry.
Creating a Live Portfolio Dashboard
Construct a master portfolio tracker that updates in real-time. Link cells to pull current prices, dividend yields, and annual income for each holding. Aggregate totals to see your portfolio's overall yield, projected income, and daily value change automatically, giving you a constantly up-to-date snapshot of your investments.
Conducting Comparative Company Analysis
Quickly pull key financial ratios and metrics for multiple companies side-by-side. Compare P/E ratios, debt-to-equity, profit margins, and revenue growth across an entire sector directly in a single sheet. This allows for fast, data-driven investment thesis development and peer group benchmarking.
Automating Financial Statement Analysis
Streamline deep dives into company fundamentals. Use formulas to import entire income statements, balance sheets, and cash flow statements over multiple years. Calculate custom ratios, track trends in revenue and EPS, and assess financial health automatically, saving hours of manual data collection and formatting.
echoloc
Identifying Emerging Opportunities
Sales teams can use Echoloc to spot companies that are in the early stages of hiring key roles, such as a Chief Data Officer. This early identification allows reps to engage prospects before their competitors do.
Targeting Rapidly Growing Companies
With insights into hiring spikes, sales reps can focus on companies that are scaling rapidly. For instance, identifying fintech startups hiring multiple engineers can signal increased infrastructure spending and new project opportunities.
Exploring New Markets
Echoloc helps businesses identify companies expanding into new geographic regions. By recognizing firms hiring their first engineering team in a new city, sales teams can tailor their approach to the unique needs of these companies.
Streamlining Sales Outreach
With evidence-based insights, sales teams can craft personalized messages that resonate with potential customers. This targeted approach not only increases response rates but also builds trust and credibility with prospects.
Overview
About Dividend Data
Dividend Data is the revolutionary toolkit that transforms your everyday spreadsheet into a professional-grade investment research terminal. Built by a dividend investor for dividend investors, it eliminates the tedious, error-prone process of manually copying and pasting stock data. With over 30 years of historical market data for more than 80,000 tickers, it brings institutional-quality financial intelligence directly into the tools you already use: Google Sheets and Microsoft Excel. The magic happens through simple, custom formulas. Just type =DIVIDENDDATA_DIVIDENDS("MSFT") and watch the forward annual dividend appear instantly. No API keys, no complex coding, and no more jumping between browser tabs. It’s designed for fundamental and dividend investors who demand deep data—dividends, yields, payout ratios, growth rates, full financial statements, key ratios, and price history—without the institutional price tag. Start with a powerful free tier offering 2,500 monthly credits that never expire, and experience the future of streamlined, data-driven investing today.
About echoloc
Echoloc is a groundbreaking platform designed to empower sales representatives, account executives, and revenue teams by uncovering hidden buying signals within job postings. In today's fast-paced sales environment, understanding when a company is ready to make purchases is crucial, and Echoloc provides the insight needed to stay ahead of the competition. By analyzing job postings for indicators of hiring activity—such as a company seeking its first data engineer or ramping up sales development representatives—Echoloc reveals actionable insights that inform sales strategies. Unlike traditional intent data providers that focus on what companies are already using, Echoloc helps sales teams identify what they are planning to build and budget for, allowing for timely outreach. With real-time updates and evidence-based results, Echoloc equips users with the information needed to approach prospects with confidence and precision.
Frequently Asked Questions
Dividend Data FAQ
How does the free tier work?
The free tier provides 2,500 credits every month, which renew automatically. There is no expiration date or trial period; you can use the free plan indefinitely. Credits are used each time a spreadsheet function recalculates and fetches fresh data from our servers, allowing for substantial usage for personal analysis and modeling.
What data can I access with the spreadsheet functions?
You can access over 100 metrics spanning dividends, quotes, financial ratios, and fundamental data. This includes forward and historical dividends, yield, ex-dividend dates, current price, volume, P/E ratio, EPS, revenue, EBITDA, and much more. Full documentation lists all available functions and their parameters.
Do I need to install software?
For Google Sheets, you install an Add-on from the Google Workspace Marketplace. For Microsoft Excel, you install an Add-in from Microsoft AppSource. Both processes are quick and guided. Once installed, the custom functions are available in your spreadsheet just like native formulas, with no separate software to run.
Is my data and portfolio information secure?
Yes. Dividend Data uses secure, encrypted connections for all data transmission. Your portfolio data and API usage are kept private. The company does not sell your personal data or investment information. You can review the full details in the Privacy Policy available on the website.
echoloc FAQ
How does echoloc gather its data?
Echoloc analyzes job postings from various online platforms and aggregates this information to provide real-time insights into hiring trends and company activities.
What types of buying signals can I expect to see?
Users can expect to discover signals related to new hires, hiring spikes, technology rollouts, and other indicators that suggest a company is preparing to invest in new solutions.
Can I use echoloc for international companies?
Yes, Echoloc tracks companies globally, allowing users to identify buying signals from firms located in various countries and regions.
Is there a trial period available for new users?
Echoloc offers a demo for potential users to explore its features and capabilities before making a commitment, ensuring that it meets their sales needs effectively.
Alternatives
Dividend Data Alternatives
Dividend Data is an automatic stock data platform that brings institutional-grade financial data directly into your spreadsheets. It falls into the category of financial data tools designed for self-directed investors, specifically those focused on dividends and fundamental analysis. It turns Google Sheets and Excel into powerful, live research terminals with simple formulas. Users often explore alternatives for a few key reasons. They might need a different pricing model, require specific data points or integrations not offered, or need a solution that works on a different platform entirely. Some may seek more advanced analytical tools or a different user experience beyond the spreadsheet environment. When evaluating any tool in this space, focus on your core needs. Consider the depth and history of the data, the reliability and update frequency, the total cost, and how seamlessly it fits into your existing workflow. The best choice is the one that gives you accurate, actionable data with the least amount of friction, letting you focus on analysis instead of data collection.
echoloc Alternatives
Echoloc is a cutting-edge sales intelligence tool designed to identify potential buyers by analyzing job postings for buying signals. Falling within the Business & Finance category, Echoloc empowers sales reps, SDRs, and AEs to pinpoint companies actively hiring for roles indicative of new projects or spending. This unique approach allows users to stay ahead in a competitive landscape. Users often search for alternatives to Echoloc due to various reasons such as pricing considerations, specific feature requirements, or compatibility with existing platforms. When exploring alternatives, it’s essential to evaluate the functionality that aligns with your team's needs, the quality of data provided, and the overall user experience. A thorough comparison will ensure you find a solution that enhances your sales efforts.