Dividend Data vs Money Visualiser
Dividend Data
Get instant stock data like dividends and prices automatically in your Google Sheets or Excel.
Last updated: March 11, 2026
Money Visualiser
Transform any amount of money into interactive 3D bill stacks to visualize and compare real cash dimensions.
Last updated: February 28, 2026
Visual Comparison
Dividend Data
Money Visualiser
Feature Comparison
Dividend Data
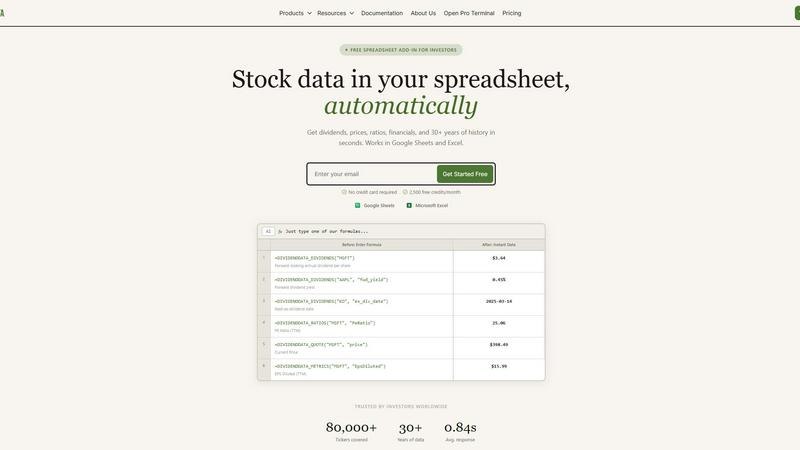
Instant Spreadsheet Integration
Access over 100 critical metrics directly in your cells with 16 simple custom formulas. Whether you need the next ex-dividend date for Coca-Cola or the current P/E ratio for Microsoft, just type a function like =DIVIDENDDATA_QUOTE("MSFT", "price") and get live, updating data in under a second. It works seamlessly in both Google Sheets and Excel, turning your spreadsheet into a dynamic, connected research platform without any coding required.
Comprehensive Dividend & Fundamental Data
Go beyond simple quotes with 30+ years of deep historical data tailored for serious analysis. Get forward dividends, yields, payout ratios, and dividend growth rates. Dive into complete financial statements, earnings reports, and essential valuation and profitability ratios. This feature provides the complete picture for evaluating a company's financial health and income potential over the long term.
Generous Free Tier with Perpetual Access
Jumpstart your analysis immediately with no credit card required. The free plan offers 2,500 credits every month, and crucially, it never expires. This allows you to thoroughly test the platform, build complex models, and perform significant research without any time pressure or trial period limitations, making professional data truly accessible.
Multi-Platform Terminal & AI Tools
Beyond spreadsheets, access the flagship Dividend Data Terminal web-app. It features advanced data visualizations, automated portfolio tracking, and an AI-powered research assistant. This ecosystem approach means you can conduct deep, exploratory research in the Terminal and seamlessly implement the findings in your live spreadsheet models, all within one connected platform.
Money Visualiser
Interactive 3D Bill Visualization
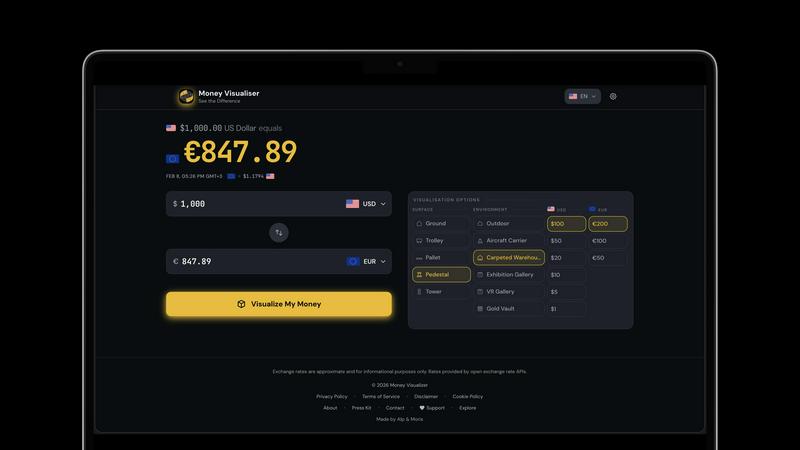
Money Visualiser offers an immersive experience by transforming monetary amounts into realistic 3D stacks of cash. Users can rotate, zoom, and explore the bill stacks from various angles, making it easier to comprehend the physical size of different amounts.
Real-Time Currency Comparison
With access to 82 world currencies, Money Visualiser allows users to select a source and target currency. Live exchange rates from the European Central Bank ensure that comparisons are accurate and up-to-date, providing a seamless way to understand currency values.
Customizable Bill Denominations
Users can switch between various bill denominations to see how the physical size of cash changes. This feature highlights the denomination effect, showcasing how $1,000,000 can take up drastically different space depending on whether it's in $100, $20, or $1 bills.
Shareable Visuals
Money Visualiser enables users to share their visualizations easily. By generating a unique URL for each comparison, users can showcase their findings on social media, in presentations, or on blogs, making financial education more engaging and accessible.
Use Cases
Dividend Data
Building a Dividend Growth Model
Easily screen and model dividend aristocrats and kings. Use functions to pull decades of dividend history and growth rates directly into your spreadsheet to calculate Chowder Numbers, analyze payout safety through ratios, and forecast future income. Automate your entire screening process to identify the most reliable long-term income stocks without manual data entry.
Creating a Live Portfolio Dashboard
Construct a master portfolio tracker that updates in real-time. Link cells to pull current prices, dividend yields, and annual income for each holding. Aggregate totals to see your portfolio's overall yield, projected income, and daily value change automatically, giving you a constantly up-to-date snapshot of your investments.
Conducting Comparative Company Analysis
Quickly pull key financial ratios and metrics for multiple companies side-by-side. Compare P/E ratios, debt-to-equity, profit margins, and revenue growth across an entire sector directly in a single sheet. This allows for fast, data-driven investment thesis development and peer group benchmarking.
Automating Financial Statement Analysis
Streamline deep dives into company fundamentals. Use formulas to import entire income statements, balance sheets, and cash flow statements over multiple years. Calculate custom ratios, track trends in revenue and EPS, and assess financial health automatically, saving hours of manual data collection and formatting.
Money Visualiser
Visualizing Salaries in Cash
Money Visualiser is an excellent tool for professionals wanting to see their annual salary represented in physical cash. By selecting their salary amount and comparing it across different currencies, users can gain insights into their earnings and how they stack up globally.
Understanding Large Amounts of Money
Curious about what a million dollars looks like? With Money Visualiser, users can instantly visualize $1,000,000 in various bill denominations, making the abstract concept of large sums much more tangible and relatable.
Educational Tool for Classrooms
Teachers can leverage Money Visualiser as an educational resource to help students grasp concepts of currency and value. By visualizing different amounts, students can better understand financial literacy in a fun and interactive way.
Social Media and Content Creation
Content creators on platforms like YouTube and TikTok can utilize Money Visualiser to produce eye-catching visuals. By capturing screenshots or sharing URLs, creators can engage their audiences with "what does X look like" scenarios, adding value to their content without any watermarks.
Overview
About Dividend Data
Dividend Data is the revolutionary toolkit that transforms your everyday spreadsheet into a professional-grade investment research terminal. Built by a dividend investor for dividend investors, it eliminates the tedious, error-prone process of manually copying and pasting stock data. With over 30 years of historical market data for more than 80,000 tickers, it brings institutional-quality financial intelligence directly into the tools you already use: Google Sheets and Microsoft Excel. The magic happens through simple, custom formulas. Just type =DIVIDENDDATA_DIVIDENDS("MSFT") and watch the forward annual dividend appear instantly. No API keys, no complex coding, and no more jumping between browser tabs. It’s designed for fundamental and dividend investors who demand deep data—dividends, yields, payout ratios, growth rates, full financial statements, key ratios, and price history—without the institutional price tag. Start with a powerful free tier offering 2,500 monthly credits that never expire, and experience the future of streamlined, data-driven investing today.
About Money Visualiser
Money Visualiser is a groundbreaking web application designed to transform monetary values into stunning interactive 3D representations of banknotes. It allows users to visualize any amount of money in real time, selecting from 82 different currencies. Imagine entering an amount and instantly seeing a stack of bills rendered to scale, based on authentic central-bank specifications. This tool is perfect for anyone curious about the physical representation of currency, whether for educational purposes, financial planning, or simply satisfying curiosity. With no signup required, users can effortlessly explore the dimensions of their wealth, compare different currencies, and share their findings with others. Money Visualiser not only enhances financial understanding but also creates an engaging visual experience that captures the true scale of money.
Frequently Asked Questions
Dividend Data FAQ
How does the free tier work?
The free tier provides 2,500 credits every month, which renew automatically. There is no expiration date or trial period; you can use the free plan indefinitely. Credits are used each time a spreadsheet function recalculates and fetches fresh data from our servers, allowing for substantial usage for personal analysis and modeling.
What data can I access with the spreadsheet functions?
You can access over 100 metrics spanning dividends, quotes, financial ratios, and fundamental data. This includes forward and historical dividends, yield, ex-dividend dates, current price, volume, P/E ratio, EPS, revenue, EBITDA, and much more. Full documentation lists all available functions and their parameters.
Do I need to install software?
For Google Sheets, you install an Add-on from the Google Workspace Marketplace. For Microsoft Excel, you install an Add-in from Microsoft AppSource. Both processes are quick and guided. Once installed, the custom functions are available in your spreadsheet just like native formulas, with no separate software to run.
Is my data and portfolio information secure?
Yes. Dividend Data uses secure, encrypted connections for all data transmission. Your portfolio data and API usage are kept private. The company does not sell your personal data or investment information. You can review the full details in the Privacy Policy available on the website.
Money Visualiser FAQ
What is Money Visualiser?
Money Visualiser is a free web-based tool that allows users to visualize any amount of money as interactive 3D stacks of banknotes. With no need for registration, this tool makes it easy to explore various currencies and their physical representations.
How does Money Visualiser determine currency dimensions?
Money Visualiser uses the official dimensions of banknotes as specified by central banks. This ensures that the 3D representations are accurate and reflect the true size of currency, allowing for realistic comparisons and visualizations.
Can I use Money Visualiser on my mobile device?
Yes, Money Visualiser is designed to be responsive and can be used on various devices, including smartphones and tablets. Users can easily visualize and compare currencies on the go.
Is there a limit to how much money I can visualize?
No, Money Visualiser allows users to enter any amount from $1 up to $999,999,999,999. This flexibility enables users to visualize both small and large sums of money in various currencies.
Alternatives
Dividend Data Alternatives
Dividend Data is an automatic stock data platform that brings institutional-grade financial data directly into your spreadsheets. It falls into the category of financial data tools designed for self-directed investors, specifically those focused on dividends and fundamental analysis. It turns Google Sheets and Excel into powerful, live research terminals with simple formulas. Users often explore alternatives for a few key reasons. They might need a different pricing model, require specific data points or integrations not offered, or need a solution that works on a different platform entirely. Some may seek more advanced analytical tools or a different user experience beyond the spreadsheet environment. When evaluating any tool in this space, focus on your core needs. Consider the depth and history of the data, the reliability and update frequency, the total cost, and how seamlessly it fits into your existing workflow. The best choice is the one that gives you accurate, actionable data with the least amount of friction, letting you focus on analysis instead of data collection.
Money Visualiser Alternatives
Money Visualiser is an innovative tool designed to transform how users perceive and interact with currency. It offers an engaging experience by allowing users to explore interactive 3D representations of bill stacks across 82 currencies, showcasing real dimensions and real-time exchange rates. As a product that falls under the Business & Finance and Content Creation categories, it caters to those interested in understanding currency value visually and contextually. Users often seek alternatives to Money Visualiser for various reasons, such as pricing, specific features, or compatibility with different platforms. It's essential to consider factors like user interface, currency selection, and the ability to share comparisons when searching for an alternative. A good option should not only meet your functional needs but also provide a user-friendly experience that enhances your financial insights.